Pandas Tutor visualizes how Python code transforms dataframes
Pandas Tutor lets you write Python pandas code in your browser
and see how it transforms your data step-by-step. (If you use R, try Tidy Data Tutor. To visualize general Python, Java, C, C++, and JavaScript code, try Python Tutor.)
Why use this tool? Let's say you're trying to explain what this
pandas code does:
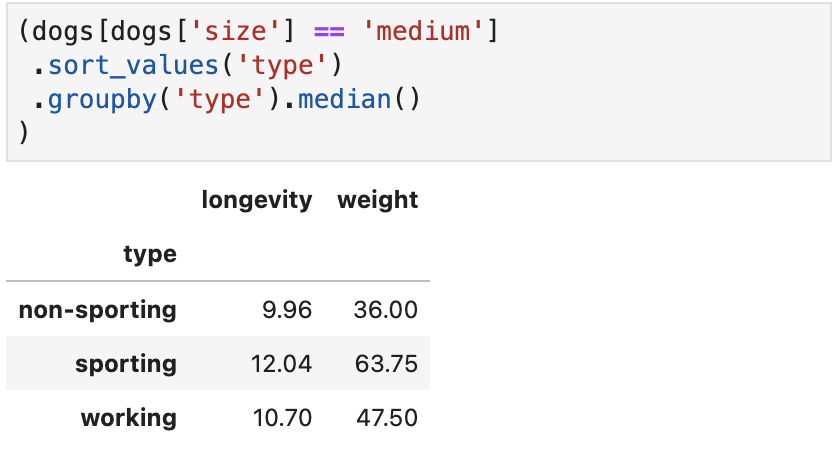
(dogs[dogs['size'] == 'medium']
.sort_values('type')
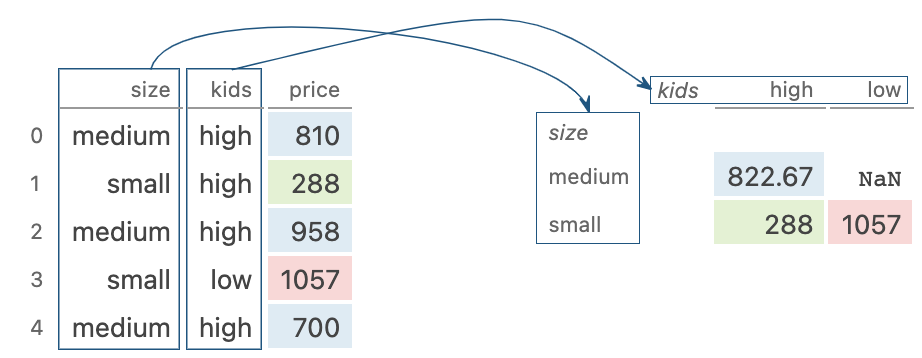
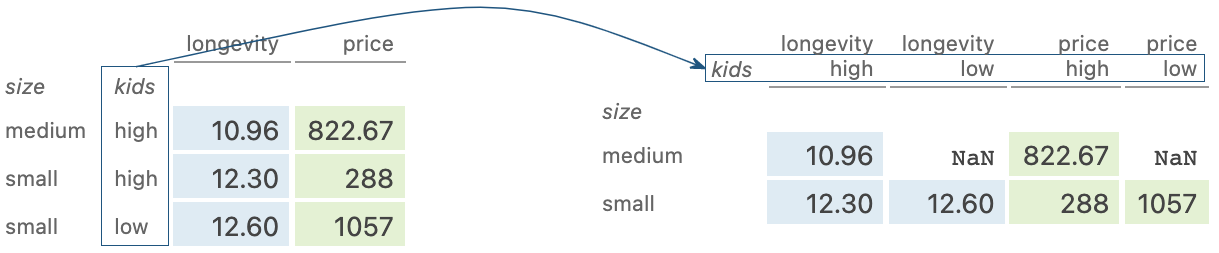
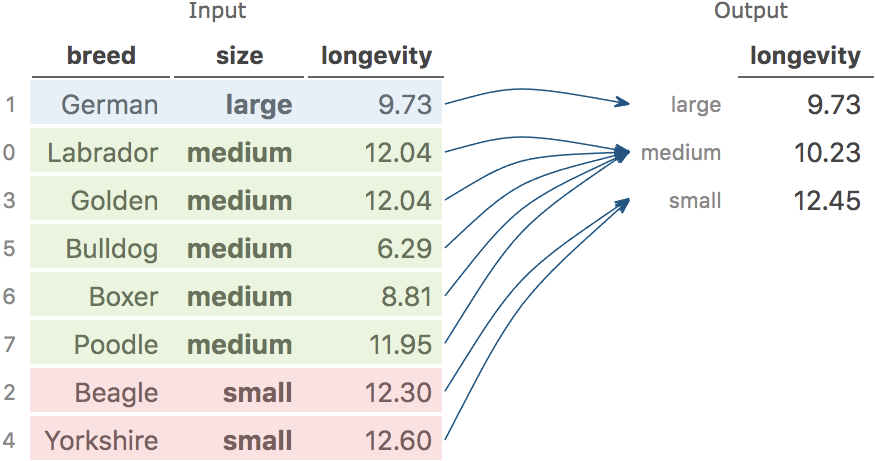
.groupby('type').median()
)
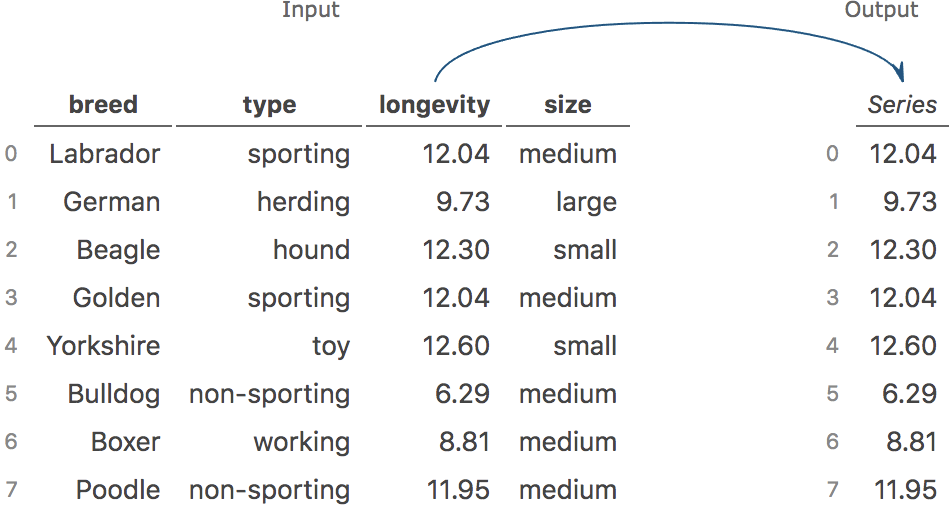
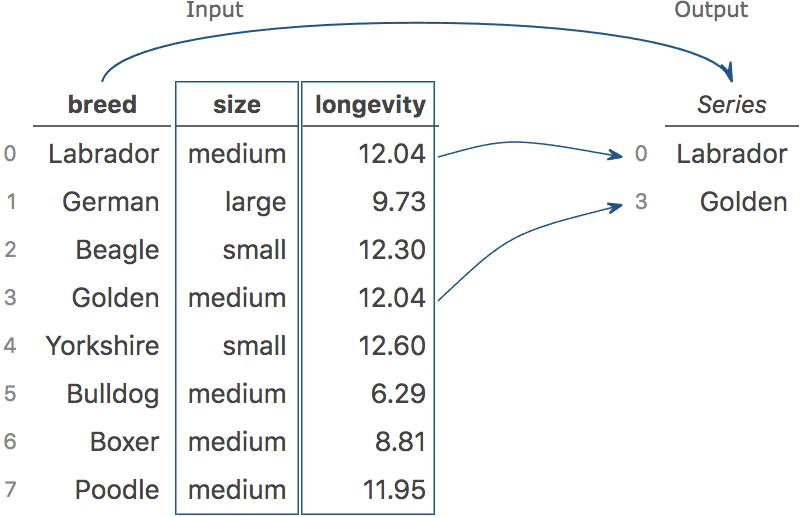
Running this code in Jupyter shows only the input data and final result:
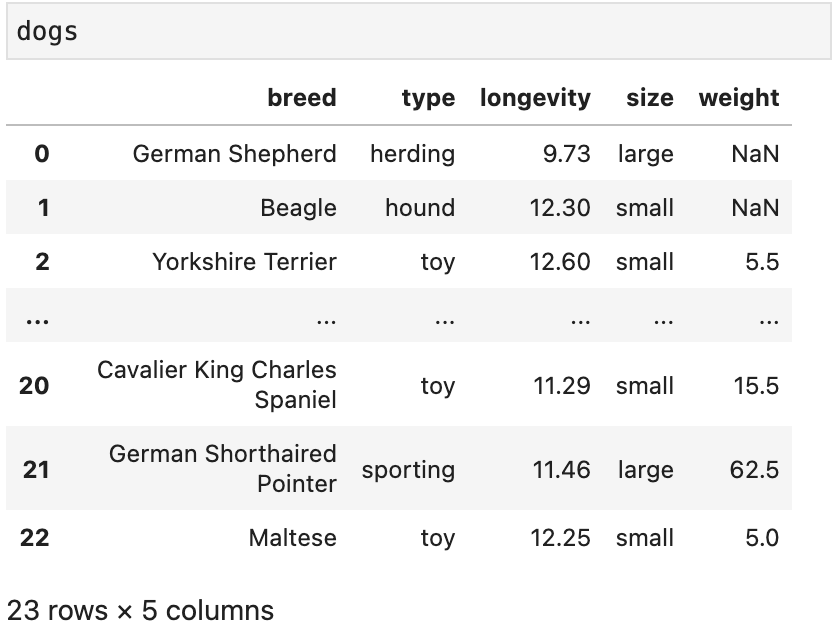
But this doesn't tell you what's going on behind the scenes.
- What did this code just do? This single code expression has 4 steps (filtering, sorting, grouping, and aggregating), but only the final output is shown.
-
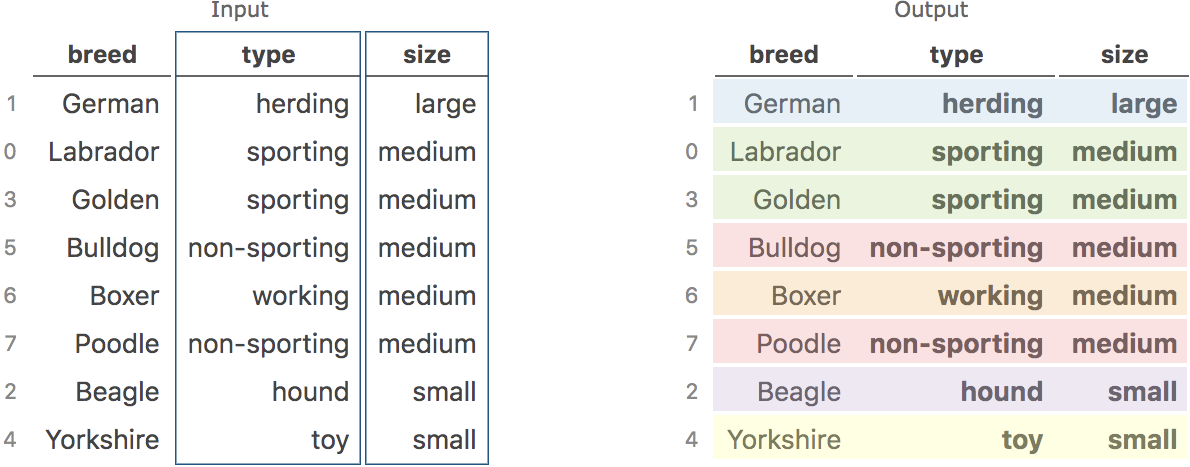
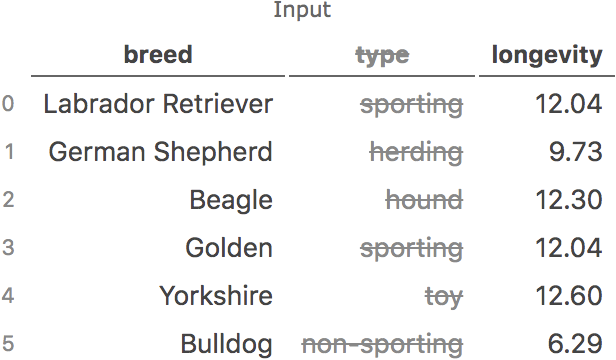
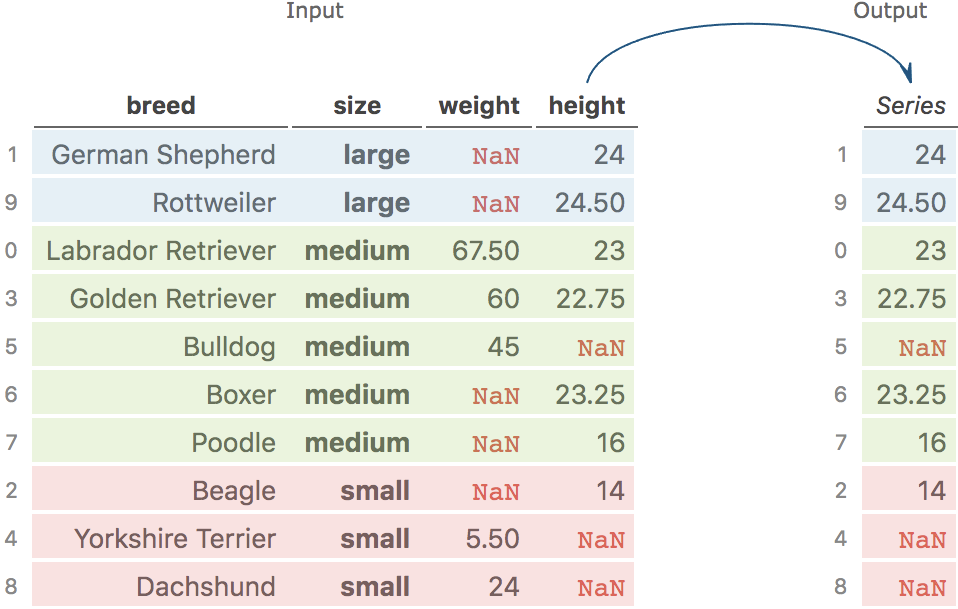
Where were the medium-sized dogs?
This code filters for dogs with size
"medium", but none of those dogs appear in the original table display (on the left) because they were buried in the middle rows. -
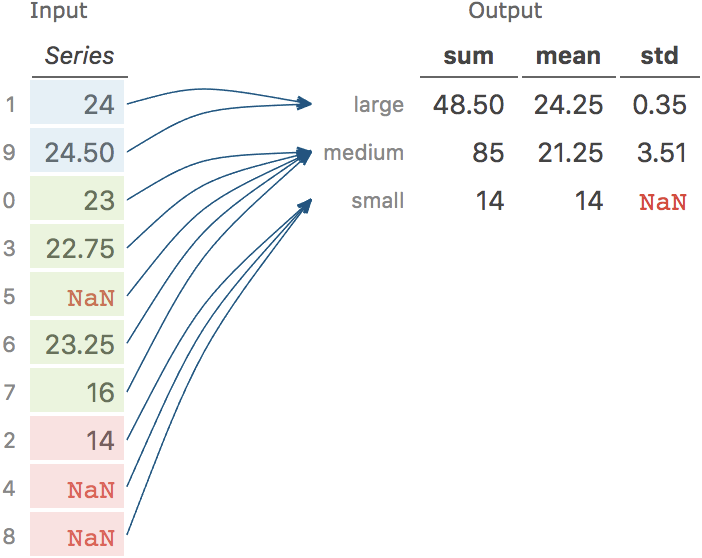
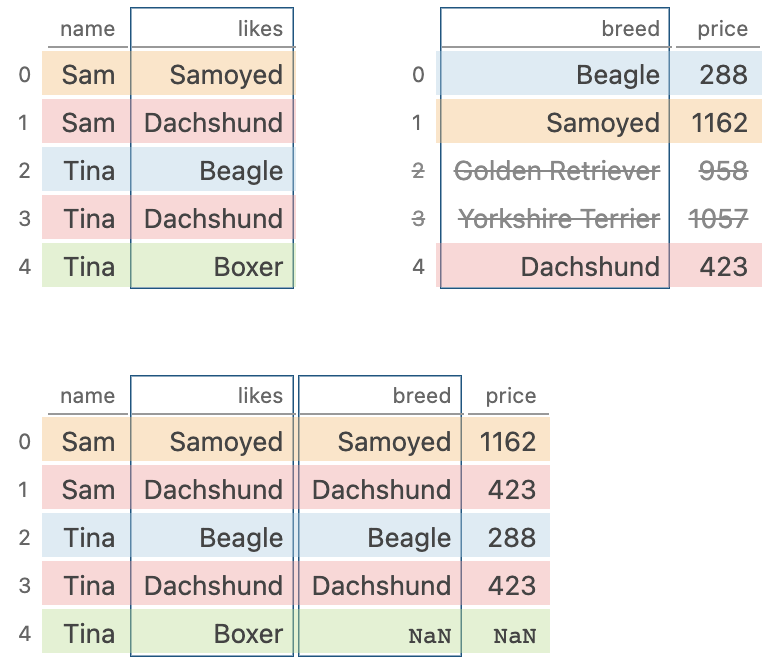
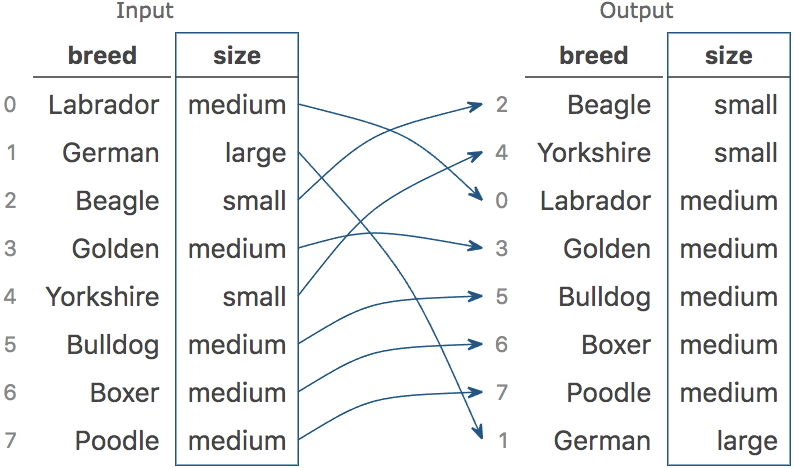
How were the rows grouped?
The output doesn't show which rows were grouped and aggregated together.
(Note that printing a
pandas.GroupByobject won't display this information either.)
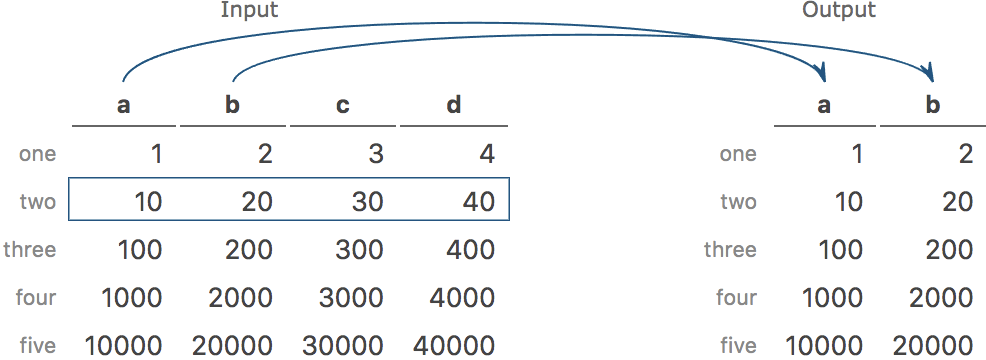
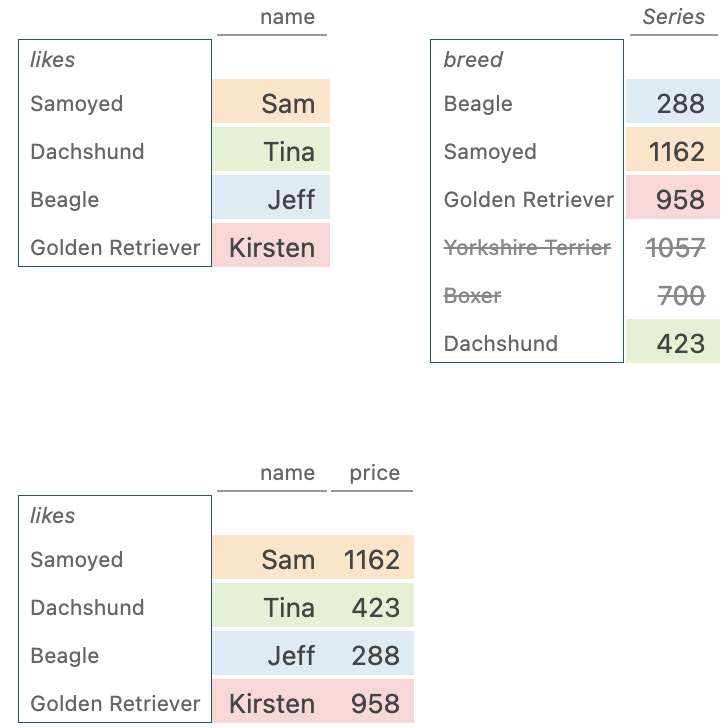
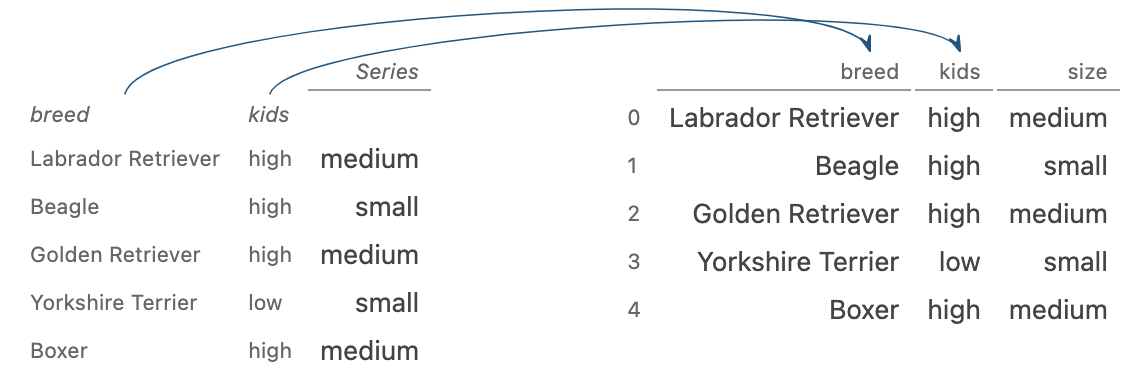
If you ran this same code in Pandas Tutor, you can teach students exactly what's going on step-by-step:
Or if you're a student, you can use this tool to explore and learn on your own. Check out more examples below: